Essential Statistics for Economics, Business and Management
Häftad, Engelska, 2007
Av Teresa Bradley, Teresa (Limerick Institute of Technology) Bradley, Bradley
969 kr
Beställningsvara. Skickas inom 5-8 vardagar
Fri frakt för medlemmar vid köp för minst 249 kr.Essential Statistics for Economics, Business and Management is aimed at introductory undergraduate courses and assumes no prior knowledge of statistics. It will also be highly relevant for the statistics component of courses in quantitative methods. The style of the text is similar to that of the highly successful Essential Mathematics for Economics and Business by Teresa Bradley and Paul Patton, with many worked examples integrated throughout.
Produktinformation
- Utgivningsdatum2007-04-20
- Mått188 x 244 x 32 mm
- Vikt1 446 g
- FormatHäftad
- SpråkEngelska
- Antal sidor688
- FörlagJohn Wiley & Sons Inc
- ISBN9780470850794
Tillhör följande kategorier
Teresa Bradley is the author of Essential Statistics for Economics, Business and Management, published by Wiley.
- Introduction 1 CHAPTER 1: Data Collection and its Graphical Presentation 51.1 Introduction to statistics 61.2 Data collection: Samples, surveys and experiments 81.3 Some sources of statistical data 161.4 Sorting and classifying data 181.5 Charts: Bar charts, pie charts and plotting in Excel 231.6 Graphs: Histograms and Ogives. Graphs in Excel 421.7 Line and Lorenz graphs 521.8 Misleading graphs 59CHAPTER 2: Descriptive Statistics 632.1 Summary statistics for raw data: Mean, quartiles and mode 642.2 Summary statistics for grouped data: Mean, quartiles and mode 722.3 Measures of dispersion for raw data. Variance, QD, IQR 852.4 Measures of dispersion for grouped data. Variance, QD, IQR 922.5 Use of calculator for descriptive statistics 942.6 Other descriptive statistics. CV, skewness and box plots 962.7 Descriptive statistics in Excel 101CHAPTER 3: Regression and Correlation: Introduction 1133.1 Introduction to regression: Scatter plots and lines 1143.2 The least-squares line. Criteria and equation for the best fit line 1183.3 Excel: XY (scatter) plots, the least-squares lines and formulae 1273.4 Coefficient of determination and correlation 1333.5 Rank correlation. Calculate and interpret rank correlation 1443.6 Use the calculator for linear regression and correlation 1463.7 Why bother with formulae? 154CHAPTER 4: Probability 1594.1 Introduction to probability 1594.2 Multiplication and addition rules for probability 1704.3 Joint, marginal and conditional probability 1844.4 Bayes' Rule 192CHAPTER 5: Introduction to Probability Distributions 2055.1 Introduction to probability distributions and random variables 2065.2 The Binomial probability distribution 2125.3 The Poisson probability distribution 2285.4 The Normal probability distribution 2365.5 Expected values (mathematical expectation) 253CHAPTER 6: Sampling Distributions for Means and Proportions 2656.1 Statistical inference and the sampling distribution of the mean 2656.2 Sampling distribution of proportions 2756.3 Some desirable properties of estimators 282CHAPTER 7: Confidence Intervals for Means and Proportions 2877.1 Confidence intervals for the mean 2877.2 Confidence intervals for proportions 2977.3 The precision of confidence intervals for the mean 3007.4 Confidence intervals for differences between means and proportions 304CHAPTER 8: Tests of Hypothesis for Means and Proportions 3198.1 Hypothesis tests for means 3198.2 Hypothesis tests for proportions 3348.3 Hypothesis tests for the difference between means and proportions 3378.4 Minitab and Excel for confidence intervals and tests of hypothesis 349CHAPTER 9: Inference from Small Samples. Confidence Intervals and Tests of Hypothesis 3599.1 Inference from small samples: Normal populations, s known 3609.2 The Student's t distribution 3629.3 Inference from small samples: Normal populations, s NOT known 3659.4 Difference between means. Small independent samples 3709.5 F-test for equality of two variances 3789.6 Difference between means, paired samples 382CHAPTER 10: Analysis of Variance 39310.1 The rationale behind one-way analysis of variance 39310.2 One-way analysis of variance 39710.3 Two-way ANOVA 41910.4 ANOVA and design of experiment 43010.5 Excel and Minitab for ANOVA 435CHAPTER 11: Chi-squared Tests 45311.1 Introduction 45411.2 The ?2 probability distribution 45411.3 Contingency tables 45511.4 ?2 tests for independence (no association) 45611.5 ?2 test for homogeneous populations 46411.6 ?2 tests for the equality of several proportions 46611.7 Goodness of fit tests 47811.8 ?2 tests in Minitab and Excel 490CHAPTER 12: Regression Analysis 49912.1 The simple linear regression model 49912.2 Inference about the population slope (rate of change) 50412.3 Confidence intervals and prediction intervals at x = x0 51312.4 Checks on the model assumptions based on residuals plots 51812.5 Regression analysis in Minitab and Excel 52112.6 Multiple regression 534APPENDIX A: Technicalities and Conventions for Defining Class Intervals, Mid-Interval, Widths, Limits, Boundaries 545APPENDIX B: Formulae for Calculating the Quartiles for Grouped Data 547APPENDIX C: Outline of Derivation of Formulae (3.2) and (3.3) for the Slope and Intercept of the Least-Squares Line, Y = a + bX 549APPENDIX D: Brief Review of the Mathematics for the Binomial 551APPENDIX E: The Number e 555APPENDIX F: Calculation of Mean and Variance of Proportions by Expected Values 557APPENDIX G: Confidence Intervals for Means and Proportions 559APPENDIX H: Degrees of Freedom 561APPENDIX I: Notes on Summations and Double Summations 563APPENDIX J: Expressing the Estimates of Variance as Sums of Squares Divided by Degrees of Freedom in Their Simplest Form 567APPENDIX K: Sums of Squares for the One-Way ANOVA 571APPENDIX L: Fitted Values and Residuals 573APPENDIX M: Sums of Squares Identity for Two-Way ANOVA 575Chapter Solutions 577Tables 637Table 1 Cumulative Binomial Probability tables 637Table 2 Cumulative Poisson Probabilities 639Table 3 Normal probability Distribution 641Table 4 Percentage point for the Normal probability distribution 642Table 5 Percentage points of the Student’s t-distribution 643Table 6 0.5% points of the F-distribution 644Table 7 Percentage points for the Chi-squared distribution 648Table 8 Table of random numbers 649Glossary 651Index 653
Hoppa över listan
Mer från samma författare
Hoppa över listan
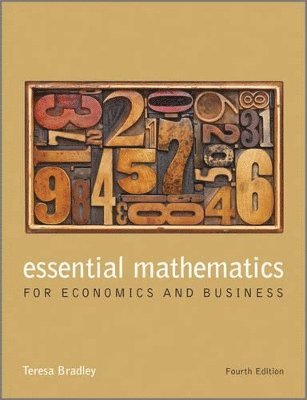
Du kanske också är intresserad av
International Law in the US Legal System
Curtis A. Bradley, Duke University School of Law) Bradley, Curtis A. (William Van Alstyne Professor of Law and Director of the Center for International and Comparative Law, William Van Alstyne Professor of Law and Director of the Center for International and Comparative Law, BRADLEY
1 179 kr